Interpolation
Interpolation is a method of fitting the data points to represent the value of a function. It has a various number of applications in engineering and science, that are used to construct new data points within the range of a discrete data set of known data points or can be used for determining a formula of the function that will pass from the given set of points (x,y). In this article, we are going to discuss the meaning of interpolation in Statistics, its formulas, and uses in detail.
| Also, read: |
Interpolation Meaning
Interpolation is a method of deriving a simple function from the given discrete data set such that the function passes through the provided data points. This helps to determine the data points in between the given data ones. This method is always needed to compute the value of a function for an intermediate value of the independent function. In short, interpolation is a process of determining the unknown values that lie in between the known data points. It is mostly used to predict the unknown values for any geographical related data points such as noise level, rainfall, elevation, and so on.
Interpolation Formula
The unknown value on the data points can be found using the linear interpolation and Lagrange’s interpolation formula.

Interpolation Methods
There are different types of interpolation methods. They are:
Linear Interpolation Method – This method applies a distinct linear polynomial between each pair of data points for curves, or within the sets of three points for surfaces.
Nearest Neighbour Method – This method inserts the value of an interpolated point to the value of the most adjacent data point. Therefore, this method does not produce any new data points.
Cubic Spline Interpolation Method – This method fits a different cubic polynomial between each pair of data points for curves, or between sets of three points for surfaces.
Shape-Preservation Method – This method is also known as Piecewise Cubic Hermite Interpolation (PCHIP). It preserves the monotonicity and the shape of the data. It is for curves only.
Thin-plate Spline Method – This method consists of smooth surfaces that also extrapolate well. It is only for surfaces only
Biharmonic Interpolation Method – This method is applied to the surfaces only.
Quadratic Interpolation
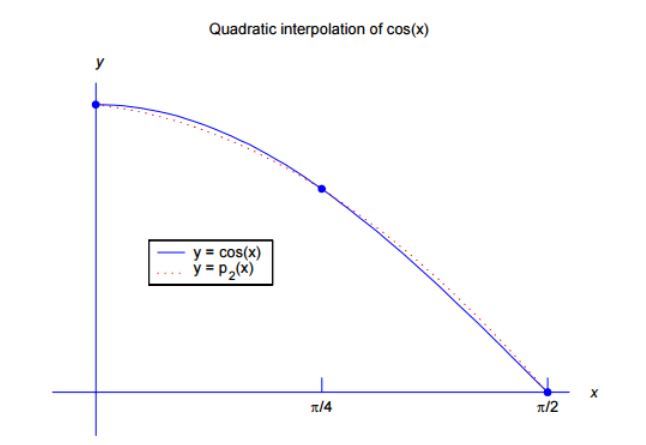
As an example, let us consider the given value
x0 = 0
x1 = π/4
x2 = π/2
and
yi = cos xi
Where i = 0, 1, 2
This gives us the three points (0, 1), (π/4, 1/√2), and (π/2, 0)
Now finding a quadratic polynomial that will contain the points-

For which
p(xi) = yi
i = 0, 1, 2
The graph of this polynomial is shown on the accompanying figure. We later give an explicit formula.

Uses of Interpolation
1. Replace a set of data points {(xi, yi)} with a function given analytically.
The data may be from a known class of functions. Interpolation is then used to find the member of this class of functions that agrees with the given data. For example, data may be generated from functions of the form

Then we need to find the coefficients {aj} based on the given data values.
We may want to take function values f(x) given in a table for selected values of x, often equally spaced, and extend the function to values of x, not in the table. For example, given numbers from a table of logarithms, estimate the logarithm of a number x not in the table.
Given a set of data points {(xi,yi)}, find a curve passing thru these points that are “pleasing to the eye”. In fact, this is what is done continually with computer graphics. How do we connect a set of points to make a smooth curve? Connecting them with straight line segments will often give a curve with many corners, whereas what was intended was a smooth curve.
2. Approximate functions with simpler ones, usually polynomials or ‘piecewise polynomials’.
Is to approximate functions f(x) by simpler functions p(x), perhaps to make it easier to integrate or differentiate f(x). That will be the primary reason for studying interpolation in this course.
As an example of why this is important, consider the problem of evaluating

This is very difficult to do analytically. But we will look at producing polynomial interpolants of the integrand and polynomials are easily integrated exactly.
Interpolation and Extrapolation
The primary differences can be noted between interpolation and extrapolation are given in the below table.
| Interpolation | Extrapolation |
| It is the method of using our function to predict the value of the dependent variable for an independent variable that lies within the data set. | It is the method of using our function to predict the value of the dependent variable for an independent variable that lies outside the range of our data. |
| This works within the given data set. | This works beyond the given data set. |
Frequently Asked Questions – FAQs
What do you mean by interpolation?
Why is interpolation needed?
What is difference between interpolation and extrapolation?
What are the different methods of interpolation?
Linear Interpolation Method
Nearest Neighbour Method
Cubic Spline Interpolation Method
Shape-Preservation Method
Thin-plate Spline Method
Biharmonic Interpolation Method
What are the uses of interpolation?
Help users to determine what data might exist outside of their collected data.
Similarly, for scientists, engineers, photographers and mathematicians to fit the data for analysing the trend and so on.