Scales of Measurement
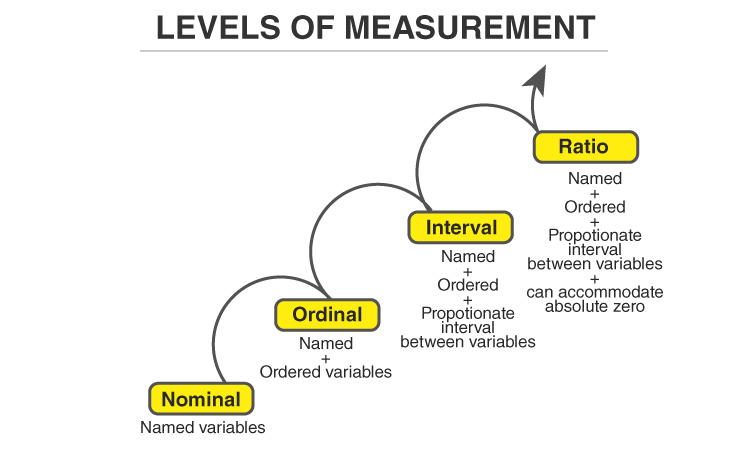
In Statistics, the variables or numbers are defined and categorised using different scales of measurements. Each level of measurement scale has specific properties that determine the various use of statistical analysis. In this article, we will learn four types of scales such as nominal, ordinal, interval and ratio scale.
What is the Scale?
A scale is a device or an object used to measure or quantify any event or another object.
Levels of Measurements
There are four different scales of measurement. The data can be defined as being one of the four scales. The four types of scales are:
- Nominal Scale
- Ordinal Scale
- Interval Scale
- Ratio Scale

Nominal Scale
A nominal scale is the 1st level of measurement scale in which the numbers serve as “tags” or “labels” to classify or identify the objects. A nominal scale usually deals with the non-numeric variables or the numbers that do not have any value.
Characteristics of Nominal Scale
- A nominal scale variable is classified into two or more categories. In this measurement mechanism, the answer should fall into either of the classes.
- It is qualitative. The numbers are used here to identify the objects.
- The numbers don’t define the object characteristics. The only permissible aspect of numbers in the nominal scale is “counting.”
Example:
An example of a nominal scale measurement is given below:
What is your gender?
M- Male
F- Female
Here, the variables are used as tags, and the answer to this question should be either M or F.
Ordinal Scale
The ordinal scale is the 2nd level of measurement that reports the ordering and ranking of data without establishing the degree of variation between them. Ordinal represents the “order.” Ordinal data is known as qualitative data or categorical data. It can be grouped, named and also ranked.
Characteristics of the Ordinal Scale
- The ordinal scale shows the relative ranking of the variables
- It identifies and describes the magnitude of a variable
- Along with the information provided by the nominal scale, ordinal scales give the rankings of those variables
- The interval properties are not known
- The surveyors can quickly analyse the degree of agreement concerning the identified order of variables
Example:
- Ranking of school students – 1st, 2nd, 3rd, etc.
- Ratings in restaurants
- Evaluating the frequency of occurrences
- Very often
- Often
- Not often
- Not at all
- Assessing the degree of agreement
- Totally agree
- Agree
- Neutral
- Disagree
- Totally disagree
Interval Scale
The interval scale is the 3rd level of measurement scale. It is defined as a quantitative measurement scale in which the difference between the two variables is meaningful. In other words, the variables are measured in an exact manner, not as in a relative way in which the presence of zero is arbitrary.
Characteristics of Interval Scale:
- The interval scale is quantitative as it can quantify the difference between the values
- It allows calculating the mean and median of the variables
- To understand the difference between the variables, you can subtract the values between the variables
- The interval scale is the preferred scale in Statistics as it helps to assign any numerical values to arbitrary assessment such as feelings, calendar types, etc.
Example:
- Likert Scale
- Net Promoter Score (NPS)
- Bipolar Matrix Table
Ratio Scale
The ratio scale is the 4th level of measurement scale, which is quantitative. It is a type of variable measurement scale. It allows researchers to compare the differences or intervals. The ratio scale has a unique feature. It possesses the character of the origin or zero points.
Characteristics of Ratio Scale:
- Ratio scale has a feature of absolute zero
- It doesn’t have negative numbers, because of its zero-point feature
- It affords unique opportunities for statistical analysis. The variables can be orderly added, subtracted, multiplied, divided. Mean, median, and mode can be calculated using the ratio scale.
- Ratio scale has unique and useful properties. One such feature is that it allows unit conversions like kilogram – calories, gram – calories, etc.
Example:
An example of a ratio scale is:
What is your weight in Kgs?
- Less than 55 kgs
- 55 – 75 kgs
- 76 – 85 kgs
- 86 – 95 kgs
- More than 95 kgs
For more information related to Statistics-concepts, register at BYJU’S – The Learning App and also learn relevant Mathematical concepts.