Application Of Linear Graphs
In our day-to-day life, we observe variation in the value of different quantities depending upon the variation in values of other quantities. For example: if the number of persons visiting a restaurant increases, earning of the restaurant increases and vice versa if a number of people are employed, time taken to accomplish a job decreases. Thus, in some scenarios, the value of one quantity increases with the increase in the value of other quantity while in other cases the value of one quantity decreases with an increase in the value of other quantity. Hence, two quantities can either exist in direct proportion or indirect proportion. Relationship between these two quantities can be represented in an arithmetic manner or graphical manner (using graphs). Sometimes these two quantities exhibit a linear dependence, in other words, variation in the value of one quantity is proportional to the first power of variation in the value of other quantity. We generally represent this with the help of linear graphs.
Linear Graph Applications
Problem: Sakshi can ride a scooter constantly at a speed of 20 km/hour. Draw a distance-time graph for this situation. With the help of the linear graph, calculate
- The time taken by Sakshi to ride 100 km.
- The distance covered by Sakshi in 3 hours.
Solution: Let us try and form a table of values correlating the time of travel and the distance travelled by Sakshi in the particular time interval.
| Time (hr) | 1 | 2 | 3 | 4 | 5 | 6 |
| Distance (km) | 20 | 40 | 60 | 80 | 100 | 120 |
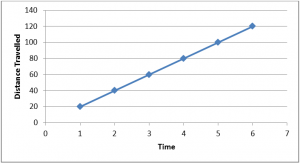
Let us draw a graph with the help of these tabulated values,

With the help of the above graph, we can calculate the required values,
- Time taken to cover 100 km by Sakshi :
From the graph,
X-coordinate of the graph corresponding to the Y-coordinate of the graph at 100 = 5
Hence, time taken to cover 100 km by Sakshi = 5 hours
- Distance covered by Sakshi in 3 hours:
From the graph,
Y-coordinate of the graph corresponding to the X-coordinate of the graph at 3 = 60
Hence, distance covered by Sakshi in 3 hours = 60km
Learn more about graphs and how to construct different graphs, download BYJU’s-The Learning App and boost your problem-solving skills.
