
Pictograph

Suppose you were given some random people’s names and their phone numbers and asked to arrange them. How will you handle this so that it can be easily recollected? In our day-to-day life, we handle lots of situations like this. And this is the time where data handling comes in hand. We can record a data in various ways, pictograph is one among them. Let us learn more about the topic.
Data and Pictograph
Data is set of collection of names, numbers, figures, etc that convey some information.In simple words data is just a collection of raw facts and figures. It can be about anything. A data is made based on observations, research or analysis. We can depict data in different forms such as tables, charts, pictures, graphs, etc.
Pictograph is a pictorial representation of a word or expression. It is one of the methods of recording data in more interesting way. In pictograph, a data is recorded in form of images and these images help us to understand statistical information in a much easier way. However, it demands a lot of attention because chances of misinterpretation are high. A pictograph is also known as pictogram, pictorial chart, picture graph and many more.
Drawing a Pictograph
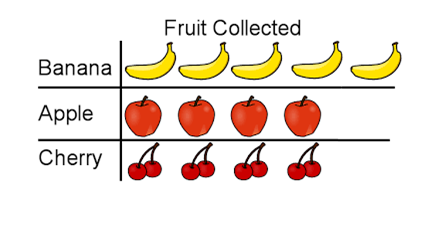
As mentioned before, pictograph is all about pictures and pictorial representation. To make it more interesting, a pictogram must be precise and properly described. Hence, we should be alert using images that we will use to represent the data. Let’s construct a pictogram of following data.
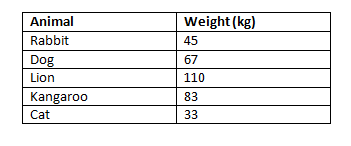
The following are the different animals and corresponding column gives their weight. Here we will represent it, as shown below.
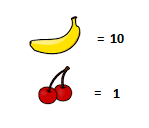
Representation:We will use banana and cherry to picturize this data. Below are value of banana and cherry:
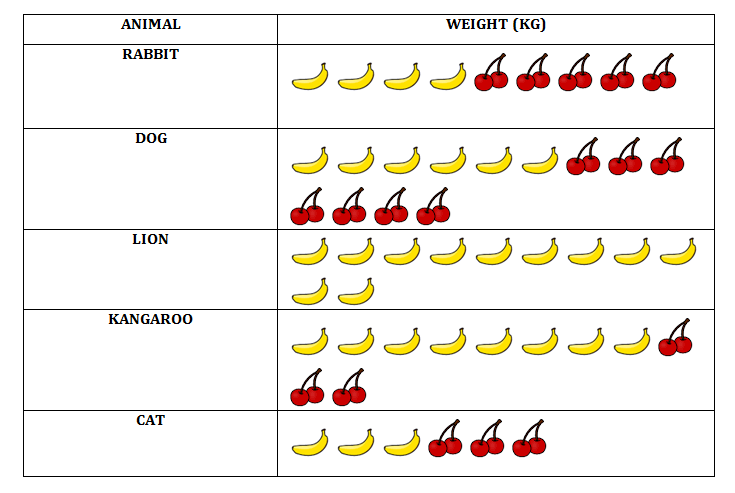
Pictograph: Pictogram of above data would be:
Any data can be easily represented using pictures. To solve more problems and to watch interactive videos on the topic, download BYJU’S – The Learning App. Also, take free tests to practice for exams.