Sampling Error
Sampling error can be measured in different ways, but in reality, the error obtained is almost always an estimate of the actual error rather than the absolute measure of the error. To calculate any true population, first, we have to calculate the sample value.
Let us take the true value of the population as “k”. But we don’t know the real value of k. So we calculated some sample value of k. After that, when the original value of k is found, it has some difference compared with the true value. The difference between these two values is called error. It can be calculated from the population and sample. Normally sampling error means the difference between the sample value and the population value.
Sampling Error Definition
Sampling error is defined as the amount of inaccuracy in estimating some value, which occurs due to considering a small section of the population, called the sample, instead of the whole population. It is also called an error. Sample surveys take into account the study of a tiny segment of a population, so, there is always a particular amount of inaccuracy in the information obtained. This inaccuracy can be defined as error variance or sampling error.
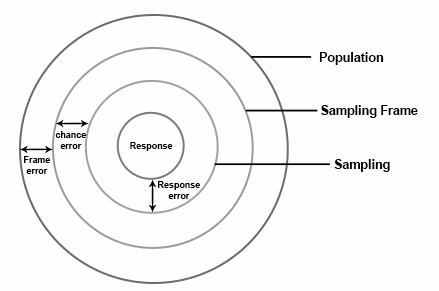
The concept of sampling error can be understood from the following diagram:

From the above diagram
Sampling Error = (Response Error) + (Frame Error) + (Chance Error)
Sampling Error Formula
The measure of the sampling error can be calculated for particular sample size and design. This measure is termed as the correctness of the sampling plan. Sampling error is also due to the concept called sampling bias. This error is considered a systematic error.
The formula to find the sampling error is given as follows:
If N is the sample size and SE is the sampling error, then
Sampling Error, S. E = (1/√ N) 100
How to Reduce Sampling Error?
There are two methods by which this sampling error can be reduced. The methods are
- Increasing sample size
- Stratification
Increasing Sample Size
From a population, we can select any sample of any size. The size depends on the experiment and the situation. If the size of the sample increases, the chance of occurrence of the sampling error will be less. There will be no error if the sample size and the population size coincide. Hence, sampling error is in inverse proportion to the sample size.
Stratification
If all the population units are homogeneous or the population has the same characteristic feature, it’s very easy to get a sample. The sample can be taken as a representative of the entire population. But if the population is not homogeneous (i.e population with the different characteristic features); it is impossible to get a perfect sample. In such conditions, to get a better representative, the sample design is altered. The population is classified into different groups called strata, that contain similar units. From each of these strata, a sub-sample is selected in a random manner. Thus, all the groups are defined in the sample, the sampling error is reduced. Hence, the sub-sample size from each stratum is in proportion with the stratum size.
Let us see a sampling error example:
Assume that the size of the population is 1000, out of which 600 are men, and 400 are women, select 100 members.
| Stratum | Size | Sample for each Stratum |
| 1 | N1 = 600 | n1 = (100×600)/1000 = 60 |
| 2 | N2 = 400 | n2 = (100×400)/1000 = 40 |
| N = 600+400 = 1000 | n = 60 +40 =100 |
Stay tuned with BYJU’S – The Learning App and explore more videos.
| Related Links | |
| Sampling Methods | Random Sampling |
| Sample Space | Scales of Measurements |